knitr::opts_chunk$set(echo = TRUE, collapse = TRUE, fig.align = "center")

library(tidyverse)
library(haven)
library(lubridate)
library(here)
library(patchwork)
library(epitools)
library(ggcorrplot)
library(patchwork)
library(plotly)

source(here("source", "load_clean_brfss.R"))
source(here("source", "filter_brfss_data.R"))
source(here("source", "standardize_brfss_variable.R"))
source(here("source", "prop_test_functions.R"))
source(here("source", "run_fishers_test.R"))

brfss_data = load_clean_brfss(here("data", "brfss_clean_2017_2024.csv.zip"))
state_fips = read_csv(here("data", "legal_sports_report", "state_fips.csv"))

state_legal_dates = read_csv(here("data", "legal_sports_report", 'state_legalization_dates.csv'))
sb_rev_by_month = read_csv(here("data", "legal_sports_report", "sb_rev_by_month.csv"))
sb_rev_by_state_month = read_csv(here("data", "legal_sports_report",'sb_rev_by_state_month.csv'))
sb_rev_by_state = read_csv(here("data", "legal_sports_report", "sb_rev_by_state.csv"))
state_pop = read_csv(here("data", "state_population_census.csv"))

years_in_data = unique(year(pull(sb_rev_by_month, month)))

outcome_vars = c("any_physical_health_not_good_days", "any_mental_health_not_good_days", "has_depressive_disorder", "has_binge_drink")

theme_set(theme_minimal() + theme(legend.position = "bottom"))
To test the relationship between sports betting legalization and health outcomes, we employed several statistical approaches: a proportion test to compare the prevalence of adverse outcomes before and after the legalization of sports betting, and a Fisher’s Exact Test to calculate the Relative Risk (RR) of these outcomes in states where sports betting is legal vs. states where it is illegal (for the most recent data in 2024). We compared outcome rates in “exposed” (sports betting is legal) and “unexposed” (sports betting is not legal) populations. We also used a linear regression model to look at the effect of legalized sports betting on any bad mental health days, and the interaction between sex and age.
Proportion Tests
Our one-sided two sample proportion tests are examining whether there is a significant change (baseline is lower) in the rates of the 4 health outcomes. In the first test, for example, the null hypothesis is that the rate of a particular outcome (e.g. binge drinking) is the same in 2017 and in 2024. The alternative is that the rate of binge drinking was less in 2017 that it was in 2024.
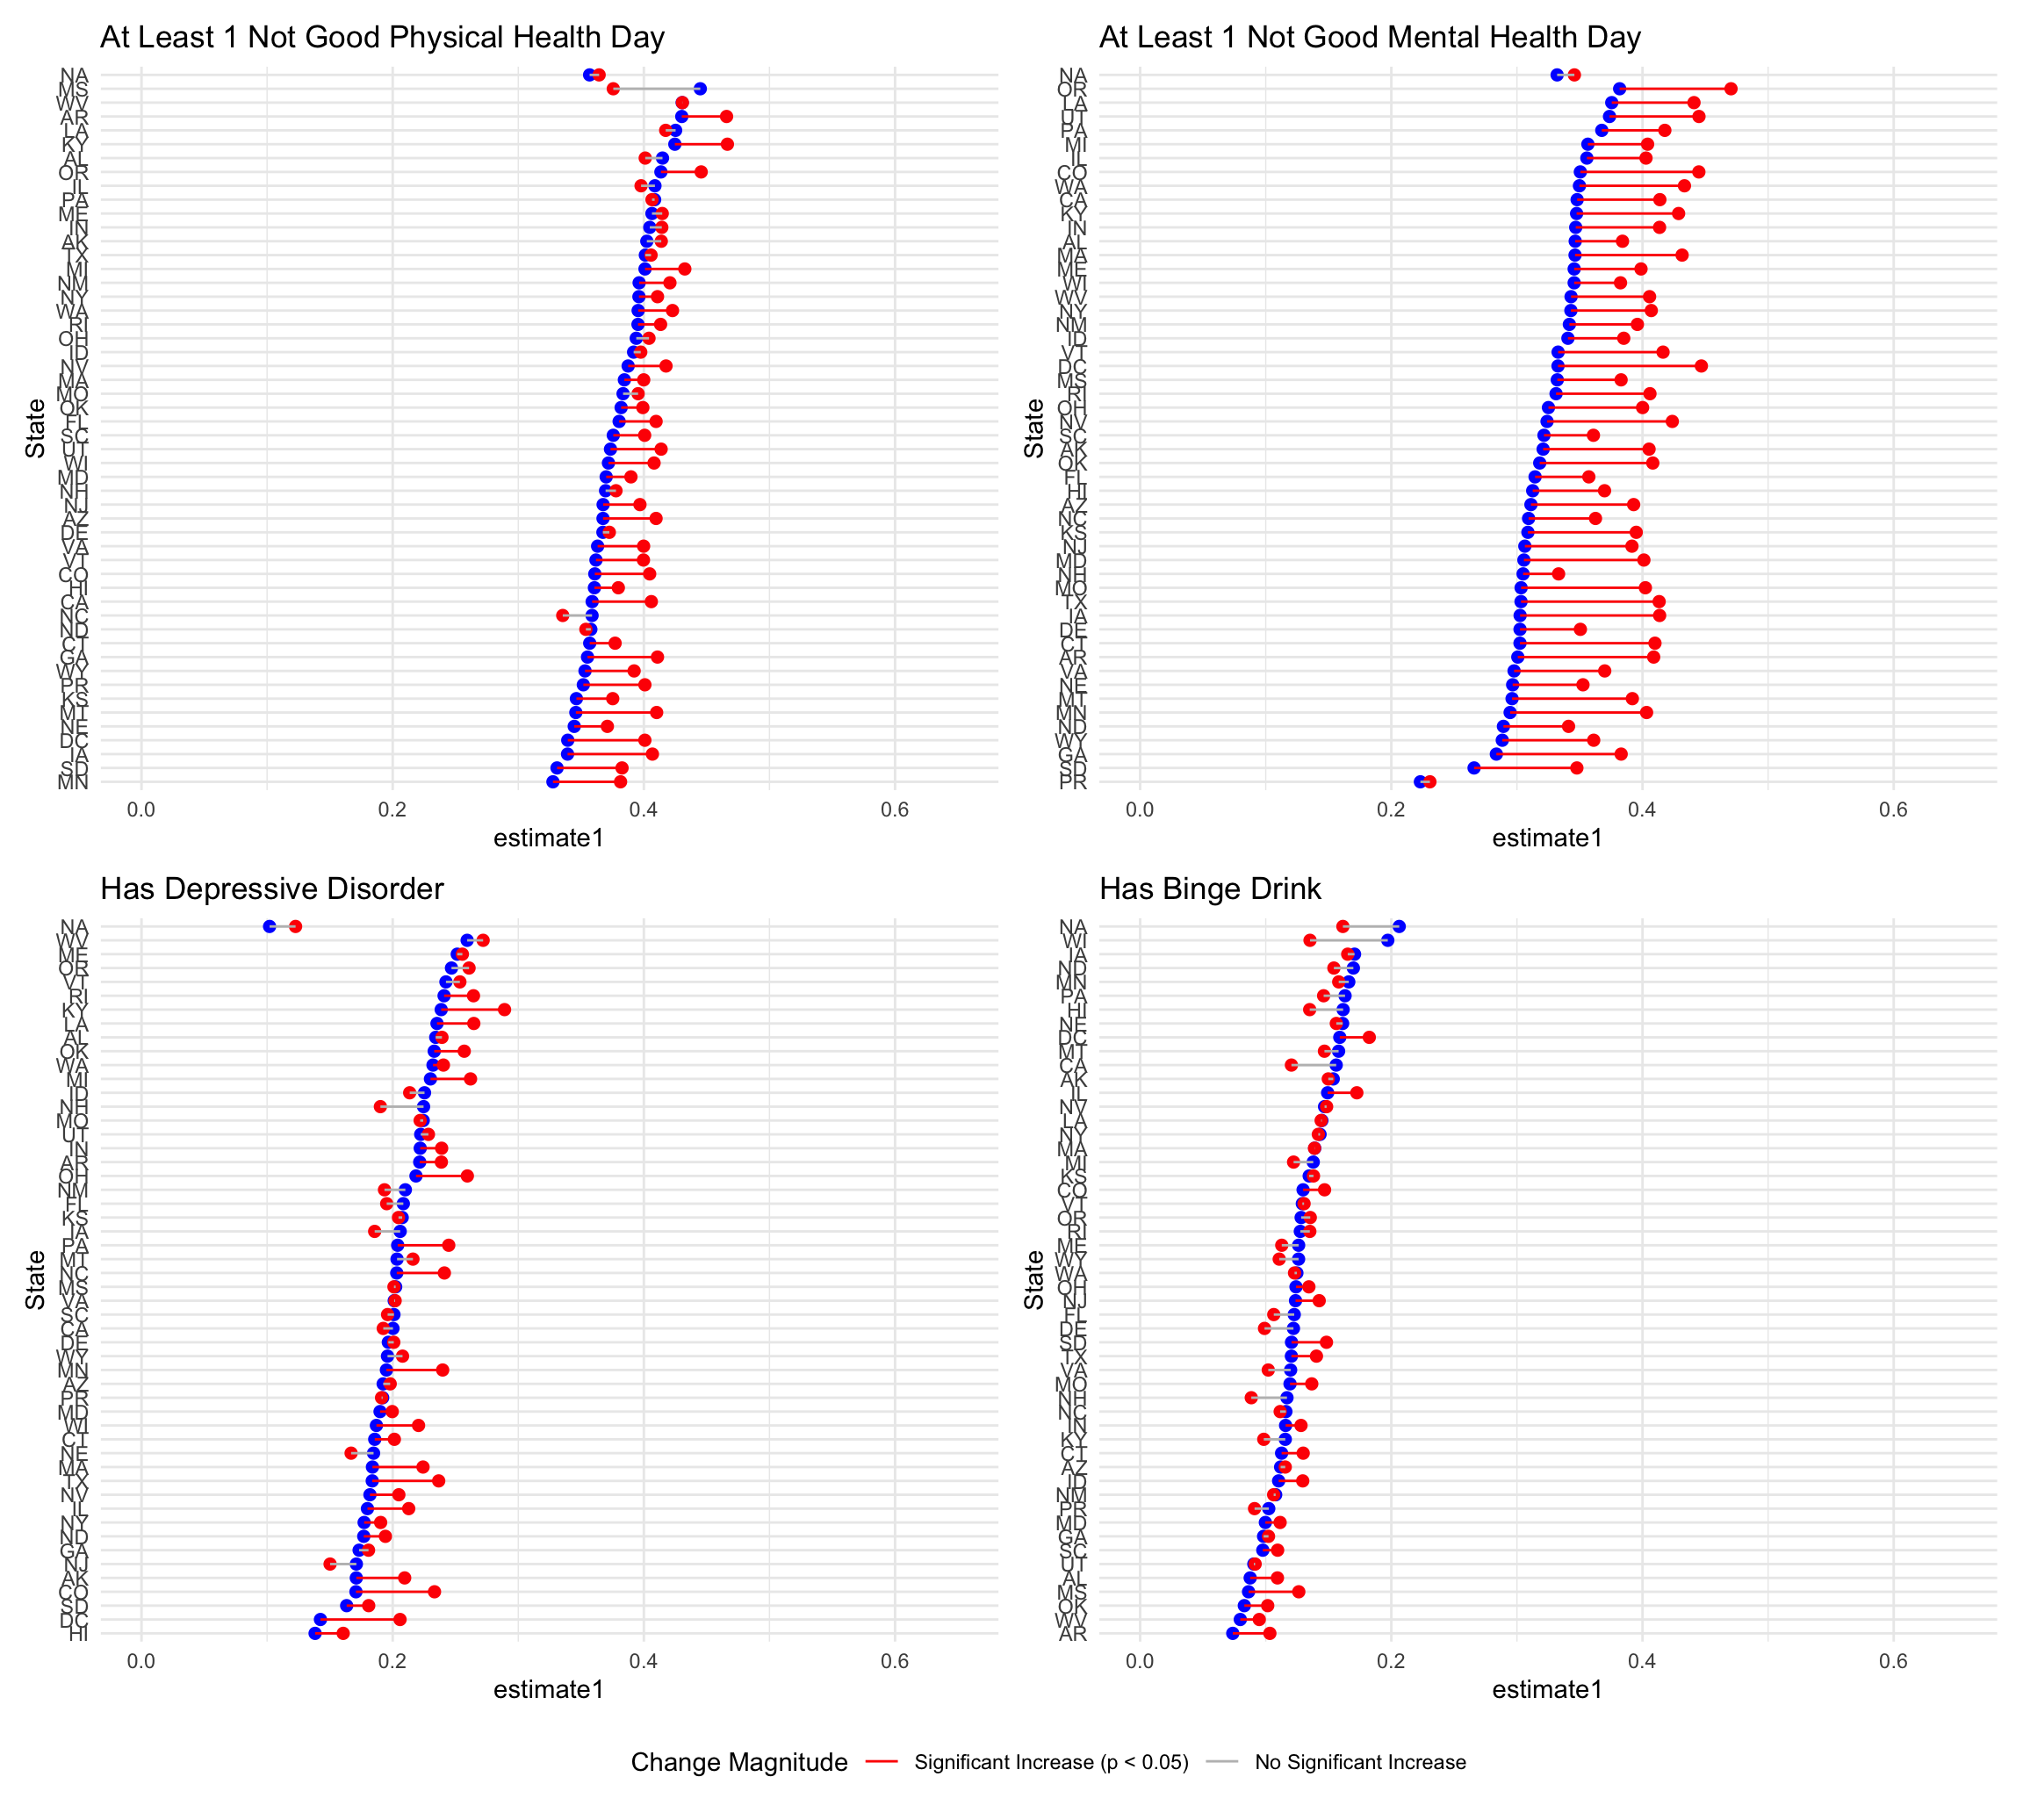
These tests looks at the raw change over time, regardless of when legalization occurred, providing a general benchmark. The lines show the change, and the color indicates statistical significance.
prop_tests_state =
  brfss_data |>
  filter(year(date) %in% c(2017, 2024)) |>
  select(state, date, all_of(outcome_vars)) |>
  pivot_longer(
    cols = all_of(outcome_vars),
    names_to = "outcome",
    values_to = "outcome_value"
    ) |>
  group_by(state, outcome) |>
  nest() |>
  mutate(test_result = map(data, run_prop_test_state)) |>
  factor_significant()

combine_plots(prop_tests_state)
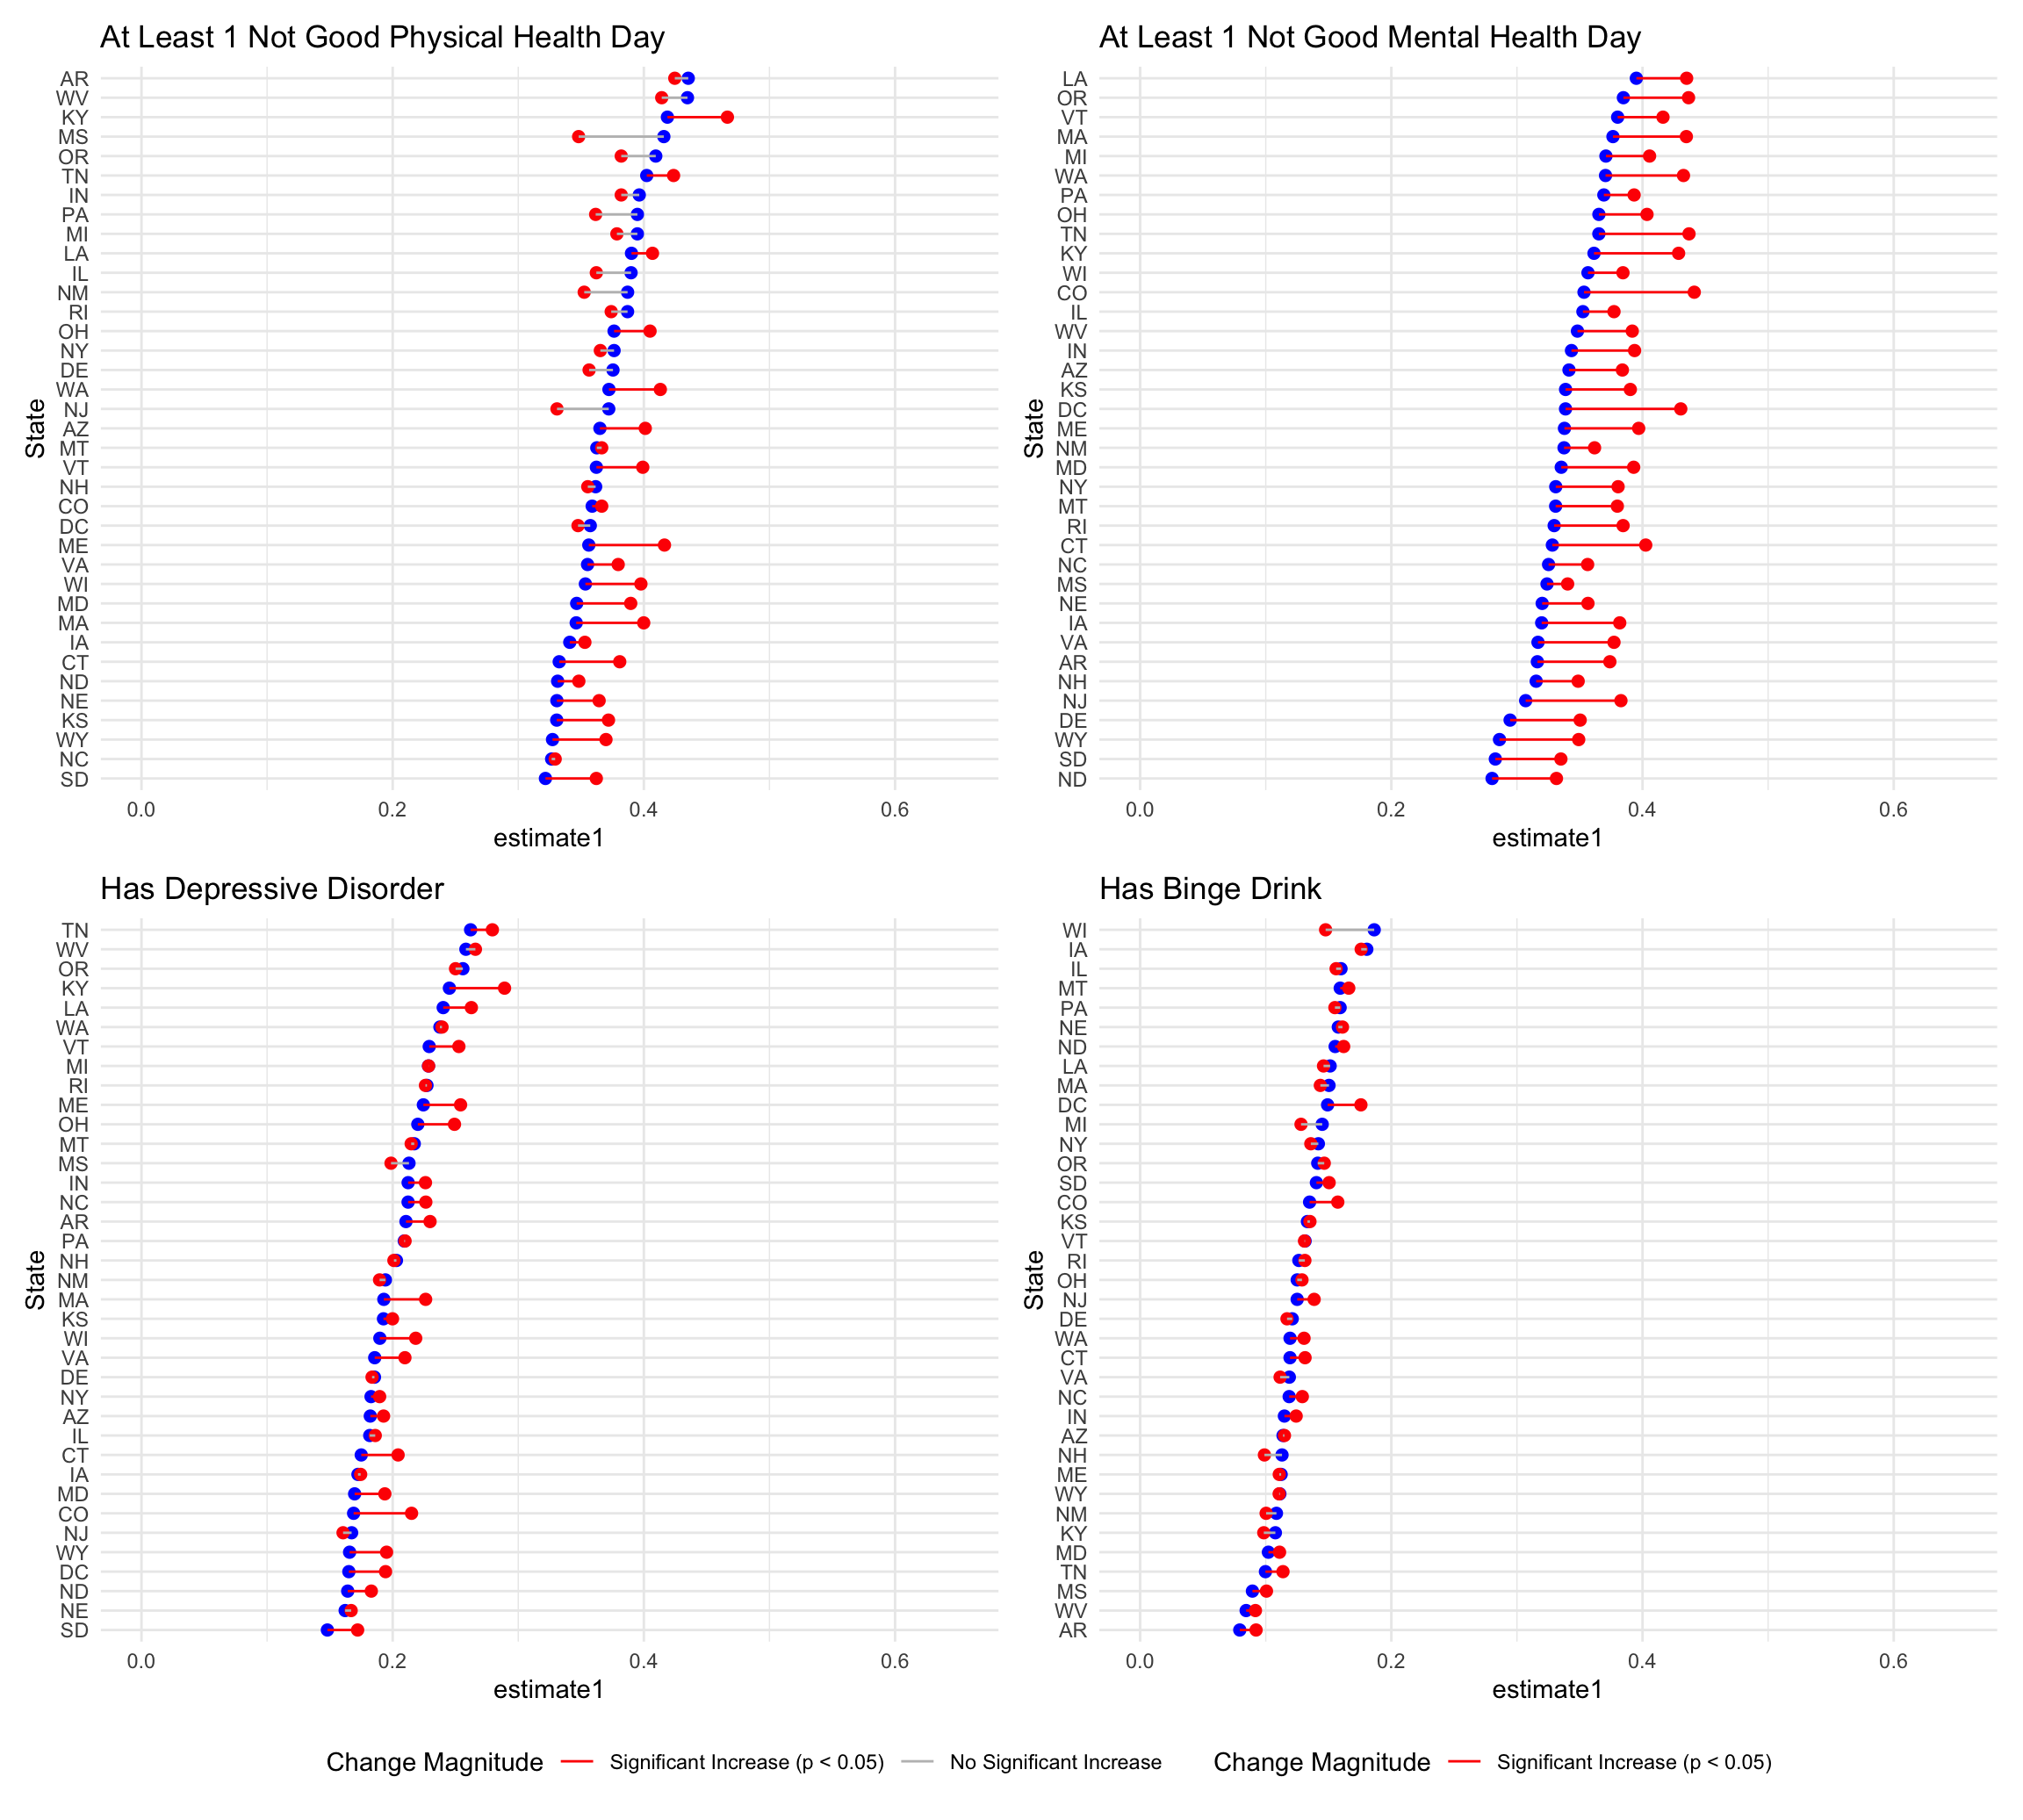
The second test we wanted to run used each state’s specific
legalization date, sb_legal, as the inflection point. We
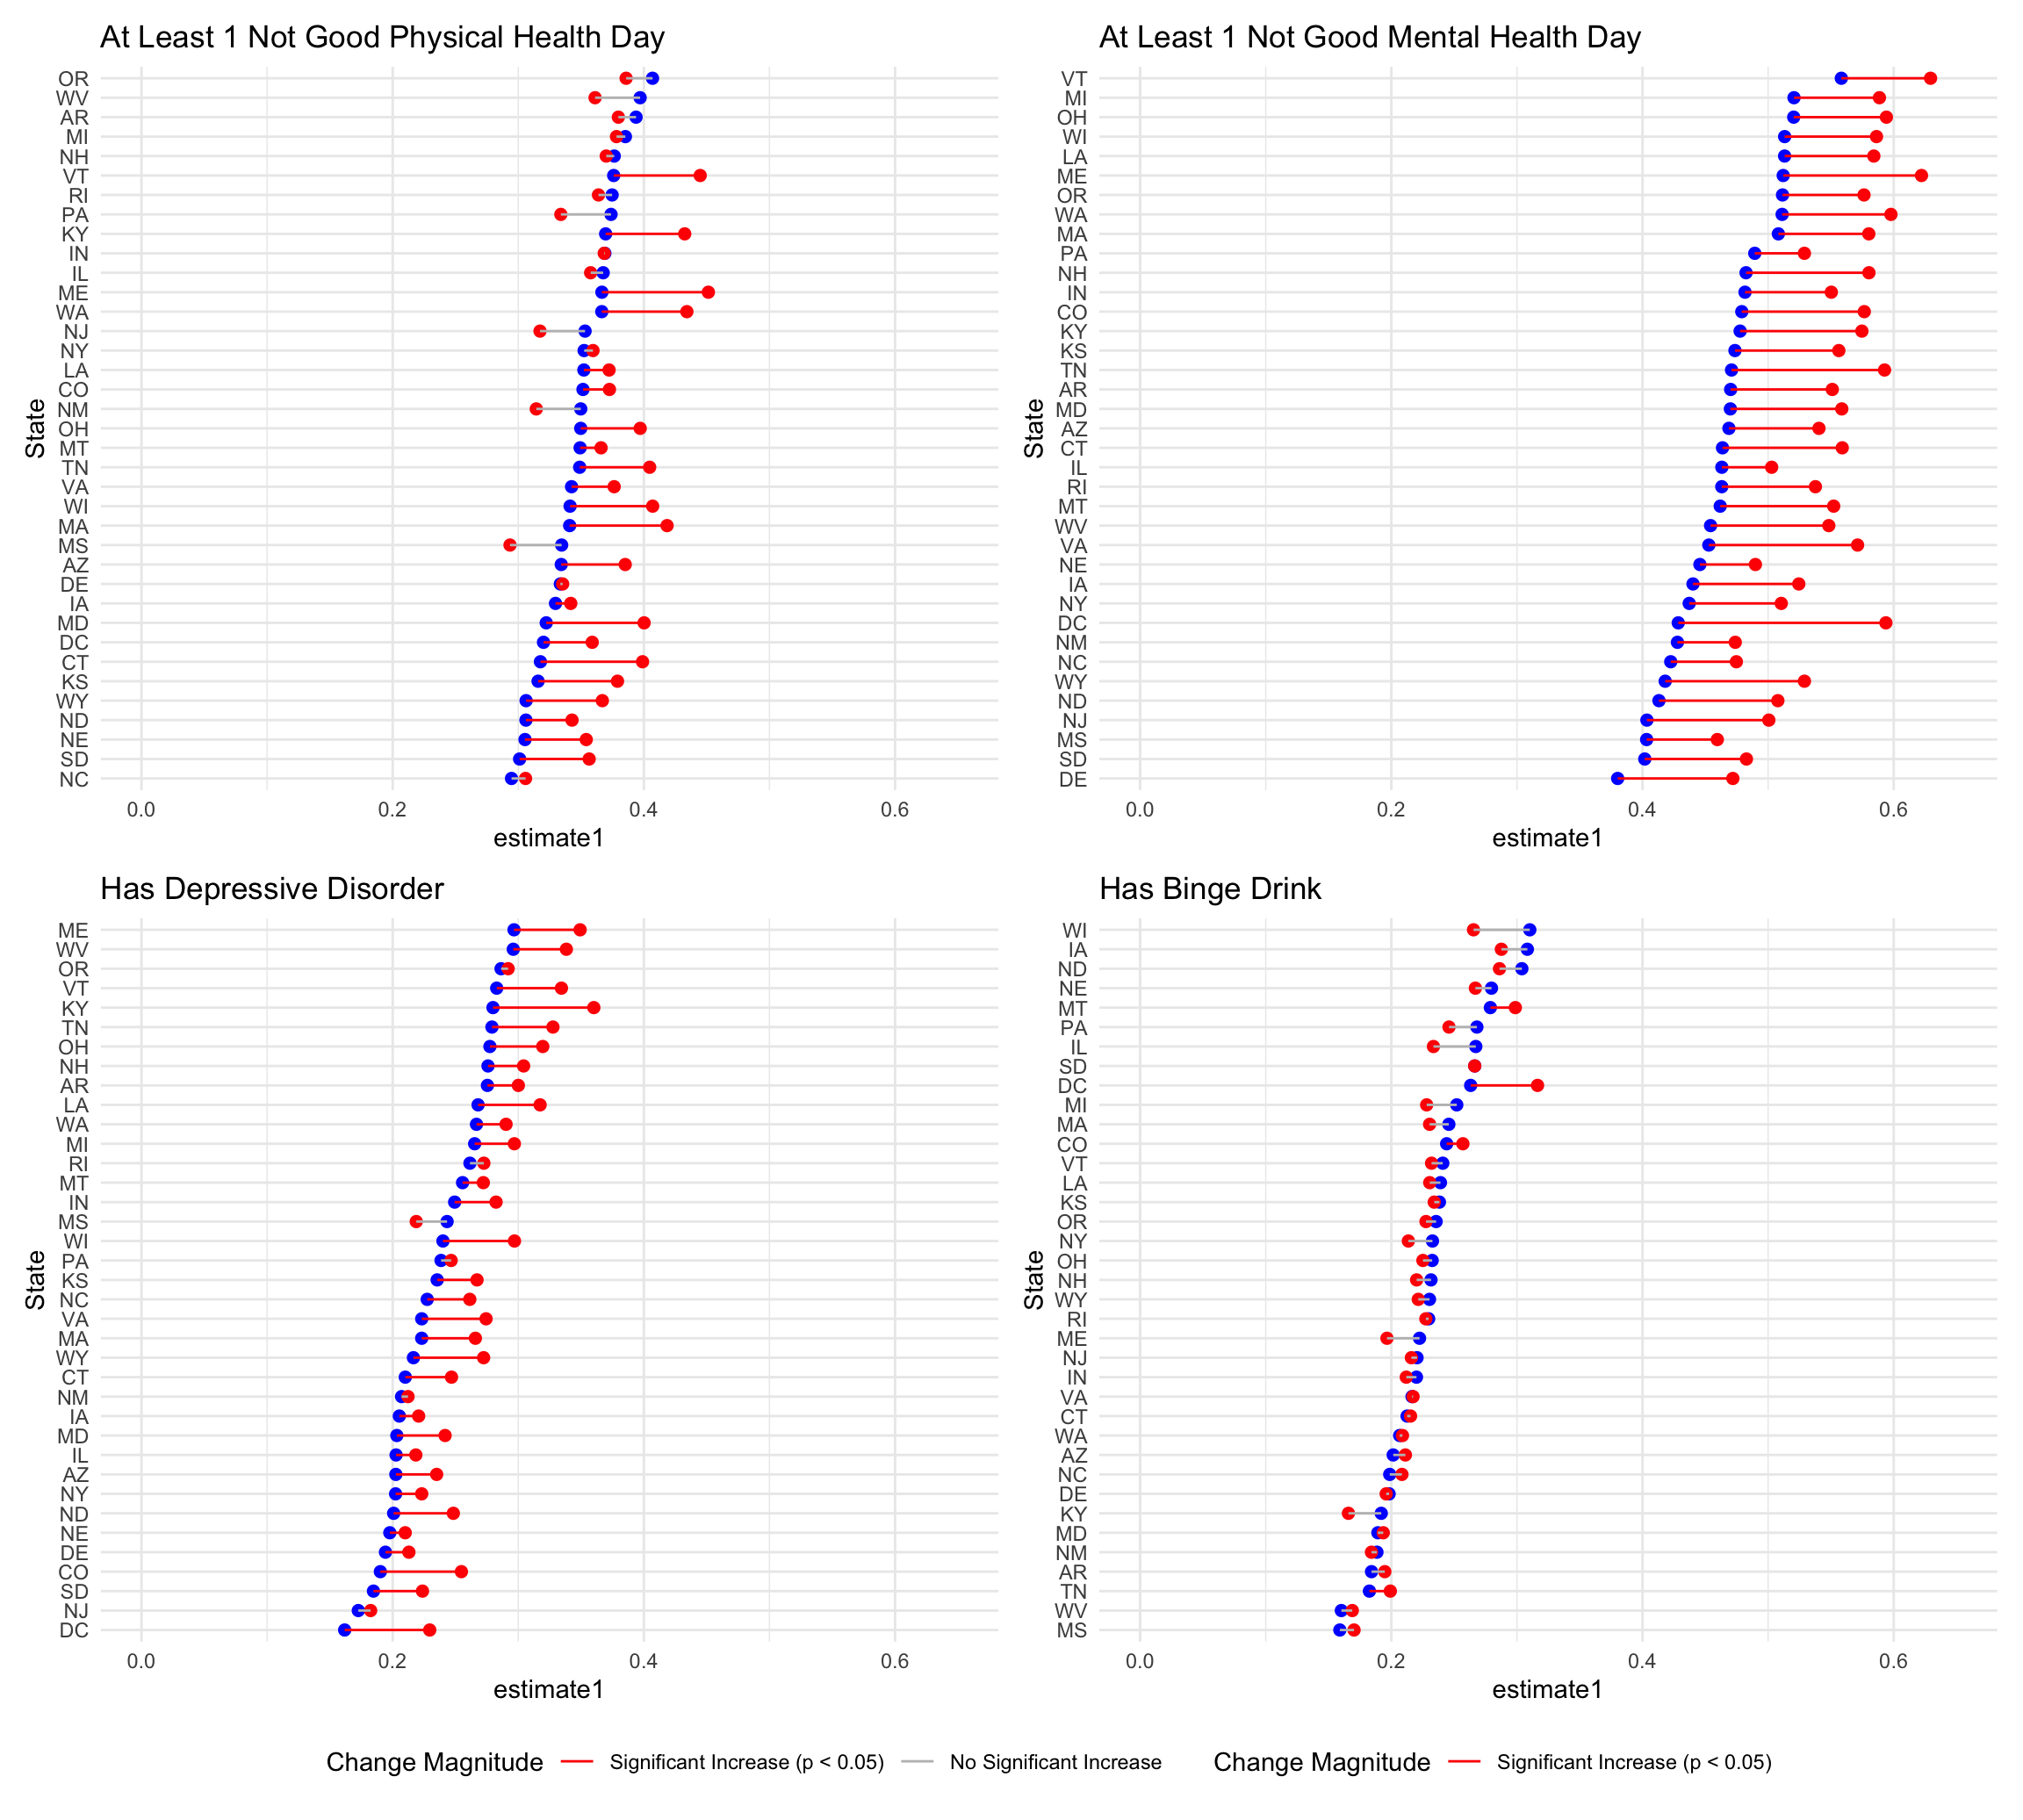
also repeated this test looking specifically at adults under 50 due to
their higher participation in sports betting.
According to PEW research, “Young adults are more likely than older Americans to say they’ve placed a sports bet in the past year.”
prop_tests_sb_legal =
  brfss_data |>
  select(state, sb_legal, all_of(outcome_vars)) |>
  pivot_longer(
    cols = all_of(outcome_vars),
    names_to = "outcome",
    values_to = "outcome_value"
    ) |>
  group_by(state, outcome) |>
  nest() |>
  mutate(test_result = map(data, run_prop_test_state_legalization)) |>
  factor_significant()

combine_plots(prop_tests_sb_legal)
prop_tests_sb_legal =
brfss_data |>
filter(age_group_5yr %in% c("18-24", "25-29", "30-34", "35-39", "40-44", "45-49")) |>
select(state, sb_legal, all_of(outcome_vars)) |>
pivot_longer(
cols = all_of(outcome_vars),
names_to = "outcome",
values_to = "outcome_value"
) |>
group_by(state, outcome) |>
nest() |>
mutate(test_result = map(data, run_prop_test_state_legalization)) |>
factor_significant()
combine_plots(prop_tests_sb_legal)Benchmark
Sports Betting Legal
Sports Betting Legal (Age < 50)
Fischer’s Exact Test
Relative Risk of Poor Mental Health Outcomes in Legal vs. Non-Legal states in 2024
In 2024, what is the risk of having poor mental health outcomes based on state legalization?
Exposure: betting legalization
Outcomes: any_physical_health_not_good_days, any_mental_health_not_good_days, has_depressive_disorder, has_binge_drink
We opted to use a Fisher’s exact test in the event that one of the counts happened to be small. The goal of this test is to determine if there is a statistically significant association between status of sports betting legalization and the presence of the 4 health outcomes.
phys_health_results =
  brfss_data |>
  filter(year(date) == 2024, age_group_5yr %in% c("18-24", "25-29"), !is.na(any_physical_health_not_good_days)) |>
  select(sb_legal, any_physical_health_not_good_days) |>
  rename(outcome = any_physical_health_not_good_days) |>
  run_fishers_test()

phys_health_results |> pull(summary) |> knitr::kable()
|
ment_health_results =
  brfss_data |>
  filter(year(date) == 2024, age_group_5yr %in% c("18-24", "25-29"), !is.na(any_mental_health_not_good_days)) |>
  select(sb_legal, any_mental_health_not_good_days) |>
  rename(outcome = any_mental_health_not_good_days) |>
  run_fishers_test()

ment_health_results |> pull(summary) |> knitr::kable()
|
depression_results =
  brfss_data |>
  filter(year(date) == 2024, age_group_5yr %in% c("18-24", "25-29"), !is.na(has_depressive_disorder)) |>
  select(sb_legal, has_depressive_disorder) |>
  rename(outcome = has_depressive_disorder) |>
  run_fishers_test()

depression_results |> pull(summary) |> knitr::kable()
|
binge_drink_results =
  brfss_data |>
  filter(year(date) == 2024, age_group_5yr %in% c("18-24", "25-29"), !is.na(has_binge_drink)) |>
  select(sb_legal, has_binge_drink) |>
  rename(outcome = has_binge_drink) |>
  run_fishers_test()

binge_drink_results |> pull(summary) |> knitr::kable()
|
Linear Regression
Any bad mental health days
brfss_data = load_clean_brfss(here::here("data", "brfss_clean_2017_2024.csv.zip")) |>
  mutate(
    month = lubridate::floor_date(date, unit = "month")
 )
## Rows: 37 Columns: 6
## ── Column specification ────────────────────────────────────────────────────────────────────
## Delimiter: ","
## chr  (2): state, abbr
## dbl  (1): fips
## date (3): first_start, online, offline
##
## ℹ Use `spec()` to retrieve the full column specification for this data.
## ℹ Specify the column types or set `show_col_types = FALSE` to quiet this message.
## Multiple files in zip: reading 'brfss_clean_2017_2024.csv'
## Rows: 2749477 Columns: 39
## ── Column specification ────────────────────────────────────────────────────────────────────
## Delimiter: ","
## chr   (2): imonth, iday
## dbl  (36): qstver, dispcode, state, seqno, iyear, sex, marital, educag, empl...
## date  (1): date
##
## ℹ Use `spec()` to retrieve the full column specification for this data.
## ℹ Specify the column types or set `show_col_types = FALSE` to quiet this message.
Filter age group < 50 (and sports betting legal)
brfss_age_data = brfss_data |>
  filter(
    age_group_5yr %in%
      c("18-24","25-29","30-34","35-39","40-44","45-49"),
    sb_legal %in% c(0, 1))
We used a linear regression model to look at the effect of legalized sports betting on any bad mental health days, and the interaction between sex and age.
fit =  lm(any_mental_health_not_good_days ~ sex + age_group_5yr + sb_legal
                             + sex * sb_legal
                             + age_group_5yr * sb_legal, data = brfss_age_data)
fit_result = fit |>
  broom::tidy() |>
  select(term, estimate, std.error, p.value)

fit_result |>
knitr::kable(digits = 3)| term | estimate | std.error | p.value |
|---|---|---|---|
| (Intercept) | 0.658 | 0.002 | 0.000 |
| sexMale | -0.140 | 0.002 | 0.000 |
| age_group_5yr25-29 | -0.067 | 0.003 | 0.000 |
| age_group_5yr30-34 | -0.106 | 0.003 | 0.000 |
| age_group_5yr35-39 | -0.135 | 0.003 | 0.000 |
| age_group_5yr40-44 | -0.168 | 0.003 | 0.000 |
| age_group_5yr45-49 | -0.183 | 0.003 | 0.000 |
| sb_legal | 0.053 | 0.003 | 0.000 |
| sexMale:sb_legal | 0.002 | 0.002 | 0.425 |
| age_group_5yr25-29:sb_legal | 0.031 | 0.005 | 0.000 |
| age_group_5yr30-34:sb_legal | 0.030 | 0.004 | 0.000 |
| age_group_5yr35-39:sb_legal | 0.022 | 0.004 | 0.000 |
| age_group_5yr40-44:sb_legal | 0.017 | 0.004 | 0.000 |
| age_group_5yr45-49:sb_legal | 0.002 | 0.004 | 0.651 |
Predicted Probability of ≥1 Mentally Unhealthy Day
# Build prediction grid
pred_df = expand.grid(
  sex = c("Female", "Male"),
  age_group_5yr = c("18-24","25-29","30-34","35-39","40-44","45-49"),
  sb_legal = c(0, 1)   # illegal = 0, legal = 1
)

# Get predicted probabilities and plot
pred_df |>
  mutate(pred_prob = predict(fit, newdata = pred_df)) |>
  ggplot(aes(x = age_group_5yr, y = pred_prob,
                    color = interaction(sex, sb_legal),
                    group = interaction(sex, sb_legal),
                    linetype = factor(sb_legal))) +
  geom_line(size = 1.1) +
  scale_color_manual(
    name = "",
    values = c(
      "Female.0" = "#AA336A",  # orange solid
      "Female.1" = "#DE3163",  # blue dashed
      "Male.0"   = "#4682B4",  # green solid
      "Male.1"   = "#0F52BA"   # blue dashed
    ),
    labels = c(
      "Female.0" = "Female - SB illegal",
      "Female.1" = "Female - SB legal",
      "Male.0"   = "Male - SB illegal",
      "Male.1"   = "Male - SB legal"
    )
  ) +
  scale_linetype_manual(
    name = "",
    values = c("0" = "solid", "1" = "dashed"),
    labels = c("0" = "SB illegal", "1" = "SB legal")
  ) +
  labs(
    x = "Age Group",
    y = "Predicted Probability",
    title = "Predicted Probability of ≥1 Mentally Unhealthy Day",
    subtitle = "Interaction: Age × Sex × Sports Betting Legalization"
  ) +
  theme_minimal(base_size = 14) +
  theme(
    legend.position = "right",
    axis.text.x = element_text(angle = 45, hjust = 1)
  )
## Warning: Using `size` aesthetic for lines was deprecated in ggplot2 3.4.0.
## ℹ Please use `linewidth` instead.
## This warning is displayed once every 8 hours.
## Call `lifecycle::last_lifecycle_warnings()` to see where this warning was generated.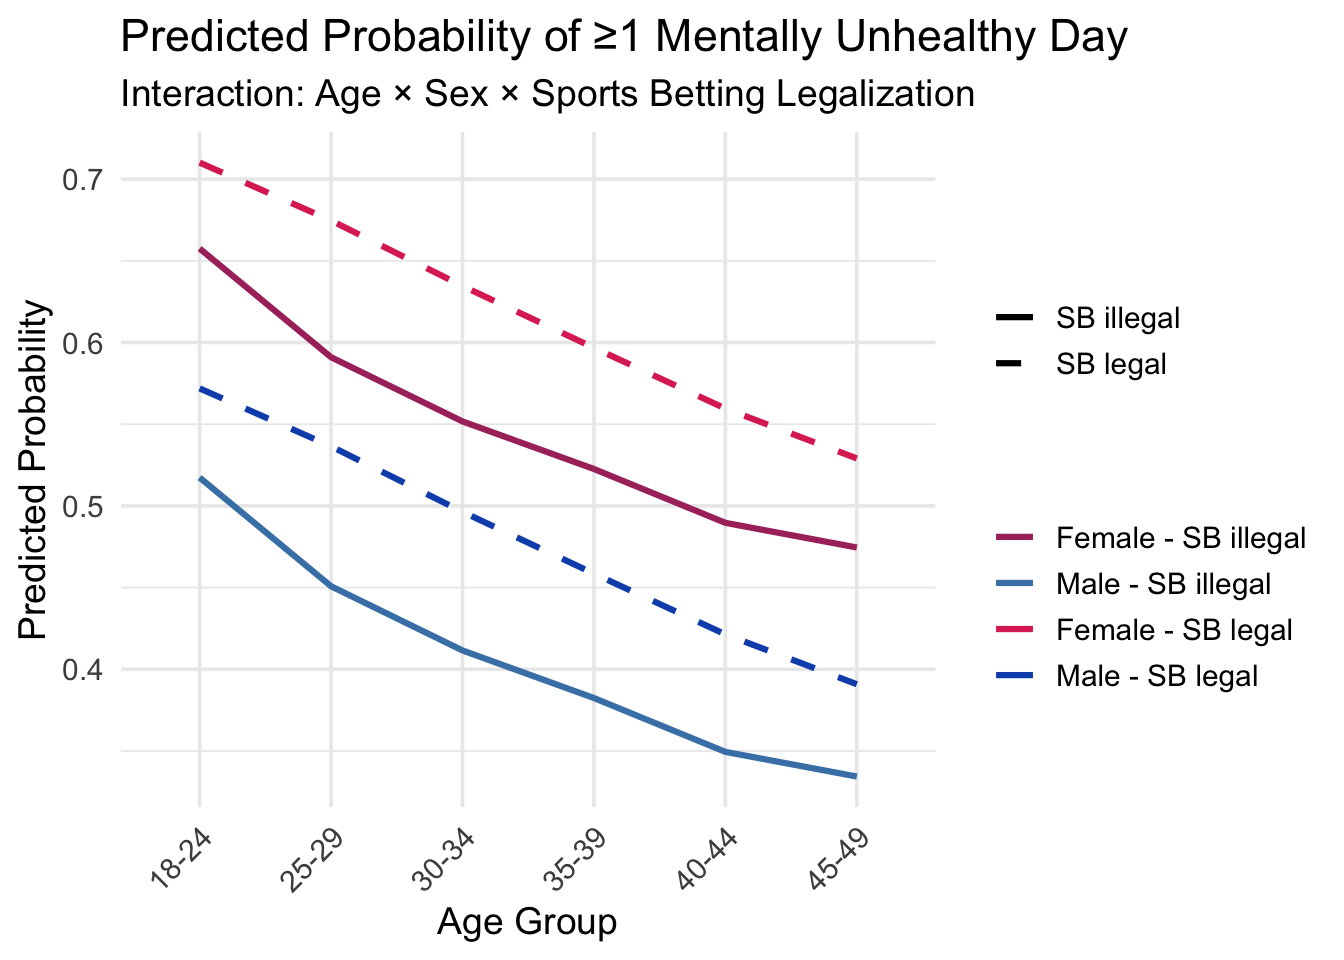
Discussion
Overall, we found a significant relationship between legalization of sports betting and poor physical/mental health. It is important to note that in our statistical analyses, even if the effect size was small, we still had a small p-value. This is likely due to the size of the BRFSS dataset (~2.7 million observations).
Our tests of proportion, which first examined the overall trend in the four health outcomes between 2017 and 2024, established two trends at the national scale. First, there is a clear increase in the rate of survey participants reporting at least one poor physical or mental health day in almost all states. This is an important benchmark for effects we observed later on. However, rates of depressive disorders showed a slight increase and rates in binge drinking remained the same across this period.
To isolate the impact of the change in sport betting legalization, we performed additional tests of proportion using each state’s date of legalization as the inflection point. These results largely mirrored the overall trends observed nationally between 2017 and 2024. This implies that the impact of sports betting legalization in a particular state did not deviate from the broader trend observed over time. One important note is that this period includes the COVID-19 pandemic, which likely had effects on health outcomes in the US and overlaps with the dates that several states legalized sports betting.
Knowing that more young adults participate in sports betting, we further filtered the data for participants under 50 years old. In this subset, the overall rate of mental health and depressive disorders was higher than the general population. This makes sense intuitively. However, the change in the rate after legalization was similar to the overall change.
When put together, these tests of proportion suggest that health outcomes have worsened since 2017 across the US overall. These results do not show that sports betting legalization changes these trends beyond what is observed temporally at the national level.
However, this conclusion is modified when we look at the relative risk of adverse health outcomes in 2024:
Among BRFSS participants in 2024 between the ages of 18 and 29, those who resided in states with legalized sports betting had:
- 1.06x risk of having at least 1 day of poor physical health
- 1.05x risk of having at least 1 day of poor mental health
- 1.07x risk of having depression
- 1.15x risk of binge drinking
compared to those residing in states where sports betting is not legal. Each of these results also show that there is a statistically significant relationship between the status of sports betting legalization and health outcomes:
- At least 1 day of poor physical health: p = 5.08e-05
- At least 1 day of poor mental health: p = 1.61e-08
- Depression: p = 5.17e-04
- Binge Drinking: p = 1.75e-10
The regression model showed baseline differences in mental health between sexes and age groups as well as the effects of legalized sports gambling. Men have a 14.02 percentage point lower probability of reporting ≥1 mentally unhealthy day compared to women (p < 0.001). All age coefficients are negative, meaning older groups report fewer mentally unhealthy days than 18–24-year-olds, This matches known demographic patterns typical in BRFSS mental health data.
The overall effect of sports betting legality (sb_legal)
was 0.053 p = 8.06e-55. In the reference group (female, age 18–24),
living in a state where sports betting is legal is associated with a
5.262 percentage point higher probability of reporting ≥1 mentally
unhealthy day in the past month.
There is no meaningful difference in the effect of sports betting legalization between men and women. The coefficient is tiny (0.0019712) and not statistically significant (p = 0.425.)
Each age interaction term tells us how much the effect of sports betting legality differs from the reference group (18–24).
fit_result |>
  filter(str_starts(term, "age_group_") & str_ends(term, "sb_legal")) |>
  select(term, estimate, p.value) |>
  mutate(
    term = str_replace_all(term, c("age_group_5yr"="", ":sb_legal"=""))
  ) |>
  rename("Age Group" = term) |>
knitr::kable(digits=3)| Age Group | estimate | p.value |
|---|---|---|
| 25-29 | 0.031 | 0.000 |
| 30-34 | 0.030 | 0.000 |
| 35-39 | 0.022 | 0.000 |
| 40-44 | 0.017 | 0.000 |
| 45-49 | 0.002 | 0.651 |
The effect is largest for adults 25-29 (0.0310474) and not significant for adults 45-49. The impact of sports betting legalization on mentally unhealthy days appears stronger for younger adults (25–44) but then plateaus. This result can also be seen in the predicted probabilty of having 1 or more bad mental health days.
The results showed how the predicted probability of reporting at least one mentally unhealthy day in the past month varies across age groups, sex, and whether sports betting is legal in the respondent’s state. When sports betting is not legal, women consistently report higher rates of mentally unhealthy days than men across all age groups. Both sexes show a steady decline in mentally unhealthy days as age increases, with 18–24-year-olds exhibiting the highest risk and 45–50-year-olds the lowest.
The effect of sports betting legalization is shown by the separation between the dashed lines (SB legal) and the solid lines. Across all age groups, the dashed lines lie above the corresponding solid lines, which means sports betting legalization is associated with a higher probability of reporting mentally unhealthy days. It also shows the size of this increase varies by age and the difference is largest among young and early-mid adults, especially ages 25–44.
The vertical distance between male and female lines remains fairly constant regardless of legalization status, which indicates women consistently report more mentally unhealthy days than men. The effect of sports betting legalization is similar for both sexes (this supports the non-significant sex × legalization interaction in the regression model).
The graph visually confirms the pattern in the coefficients: among younger adults (25–44), the increase associated with sports betting legalization is noticeably larger and this decreases with age. This suggests that younger and mid-age adults may be more sensitive to environmental or policy changes related to gambling or these age groups may participate more in gambling or be more exposed to advertising or technology that connects them to sports betting markets.
Sports betting legalization is associated with a higher probability of experiencing mentally unhealthy days, especially among adults aged 25–44, and this pattern is similar for both men and women. The effect does not appear uniform across age groups, indicating a meaningful interaction between age and policy.